AI Report Filtering (Otto)
Ask Questions in Natural Language
Start by hovering over any chart in your Cardata Intelligence dashboard. When you find a metric you'd like to explore further, click the Otto icon to open the AI query window.
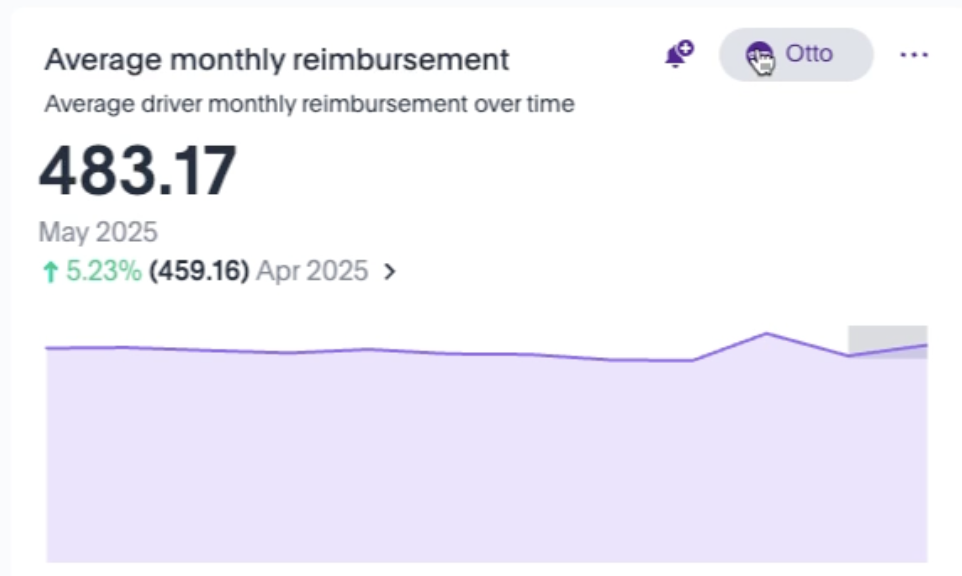
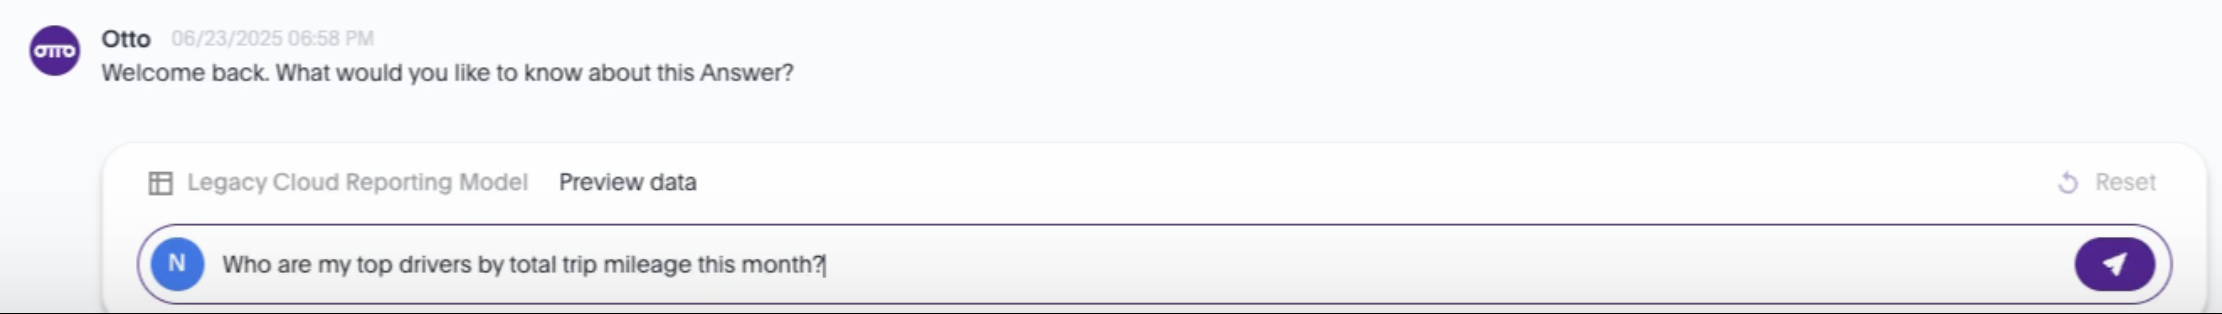
In the question box, type your request just like you’d ask a colleague. Otto will interpret your query, apply the relevant filters, and return a tailored chart based on your input.Example:
"Who are my top drivers by total trip mileage this month?"
If it’s a view you want to return to often, you can pin the chart to your dashboard for easy access, just click the pin icon and choose your preferred format (table, chart, or graph).
Edit Your Question to Adjust Filters
If you want to tweak your request, such as changing the date range or metric, just click the Edit button beside your original question.Example update:
- Change “this month” to “April 2025” in your question

Otto is Learning, and Feedback Helps
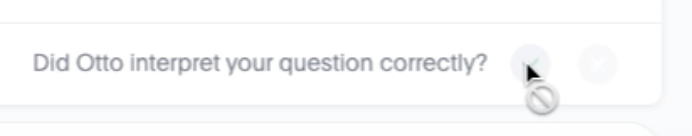
Otto is still in its beta phase and improves every time you interact with it. If it returns the right result, give it a thumbs up. If it doesn’t, adjust your query or send feedback. Every response helps Otto become more helpful and accurate.
- Think of Otto as a smart, fast-growing baby. It may be early in development, but it's already helping users explore data in a new way.
Why Use Otto?
- Filter complex reports using a single sentence
- Skip manual dropdowns and filters
- Access the data you care about faster
- Ask follow-up questions using natural language
- Pin insights you generate for ongoing visibility