AI Highlights
Get instant insights when your data changes, without lifting a finger.AI Highlights in Cardata Intelligence automatically analyzes your reimbursement data to surface meaningful trends, anomalies, and outliers. No setup required, just click, and you’re looking at a curated summary of what’s new, what’s unexpected, and what’s changing in ways you should know about.
It’s a fast, automated way to stay informed on driver behavior, program costs, and key performance indicators, without digging through dashboards.
How to use AI Highlights
How to set it up:
- Open your Cardata Intelligence dashboard.
- Locate and click the “AI Highlights” button, found near the top or in the KPI visualization panel. On this panel, you can also select your filters and properties (e.g., month, driver type, location).
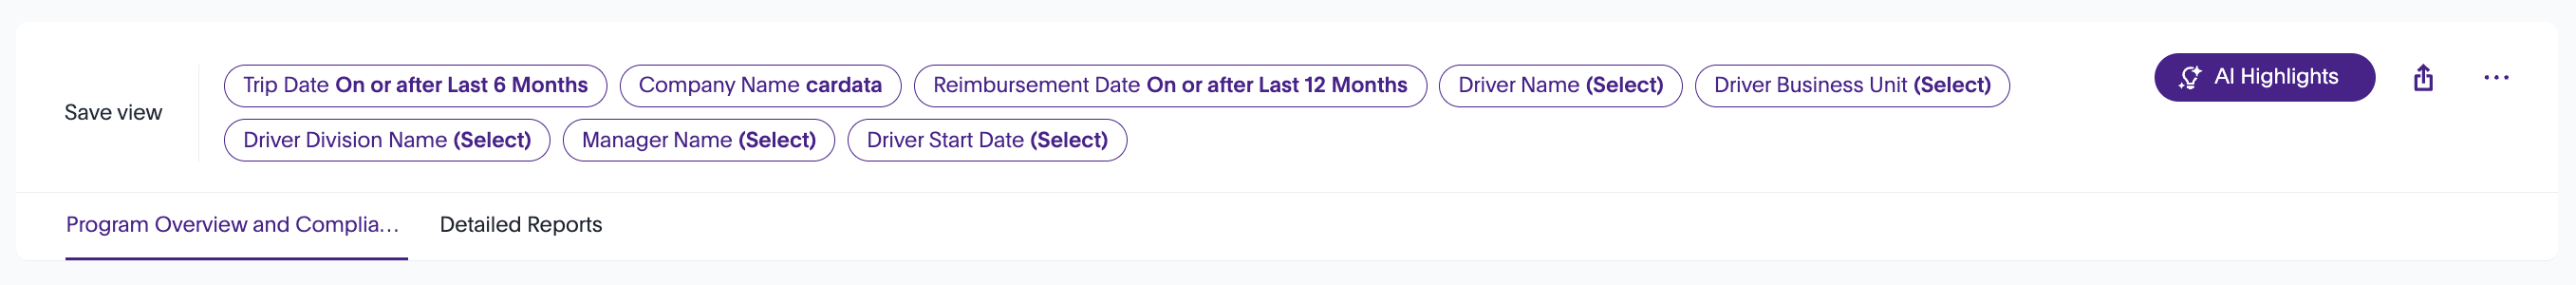
- Once you chose your select dataset(s), click the AI Highlights button to push

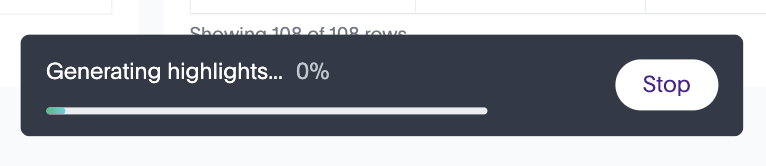
- Scroll to the bottom of the dashboard and a notification will appear, generating your highlights.
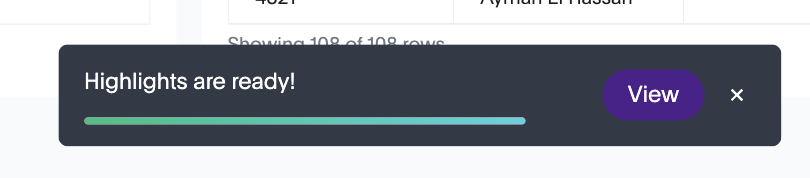
- A notification will appear: “Highlights are ready”, and click to vie.
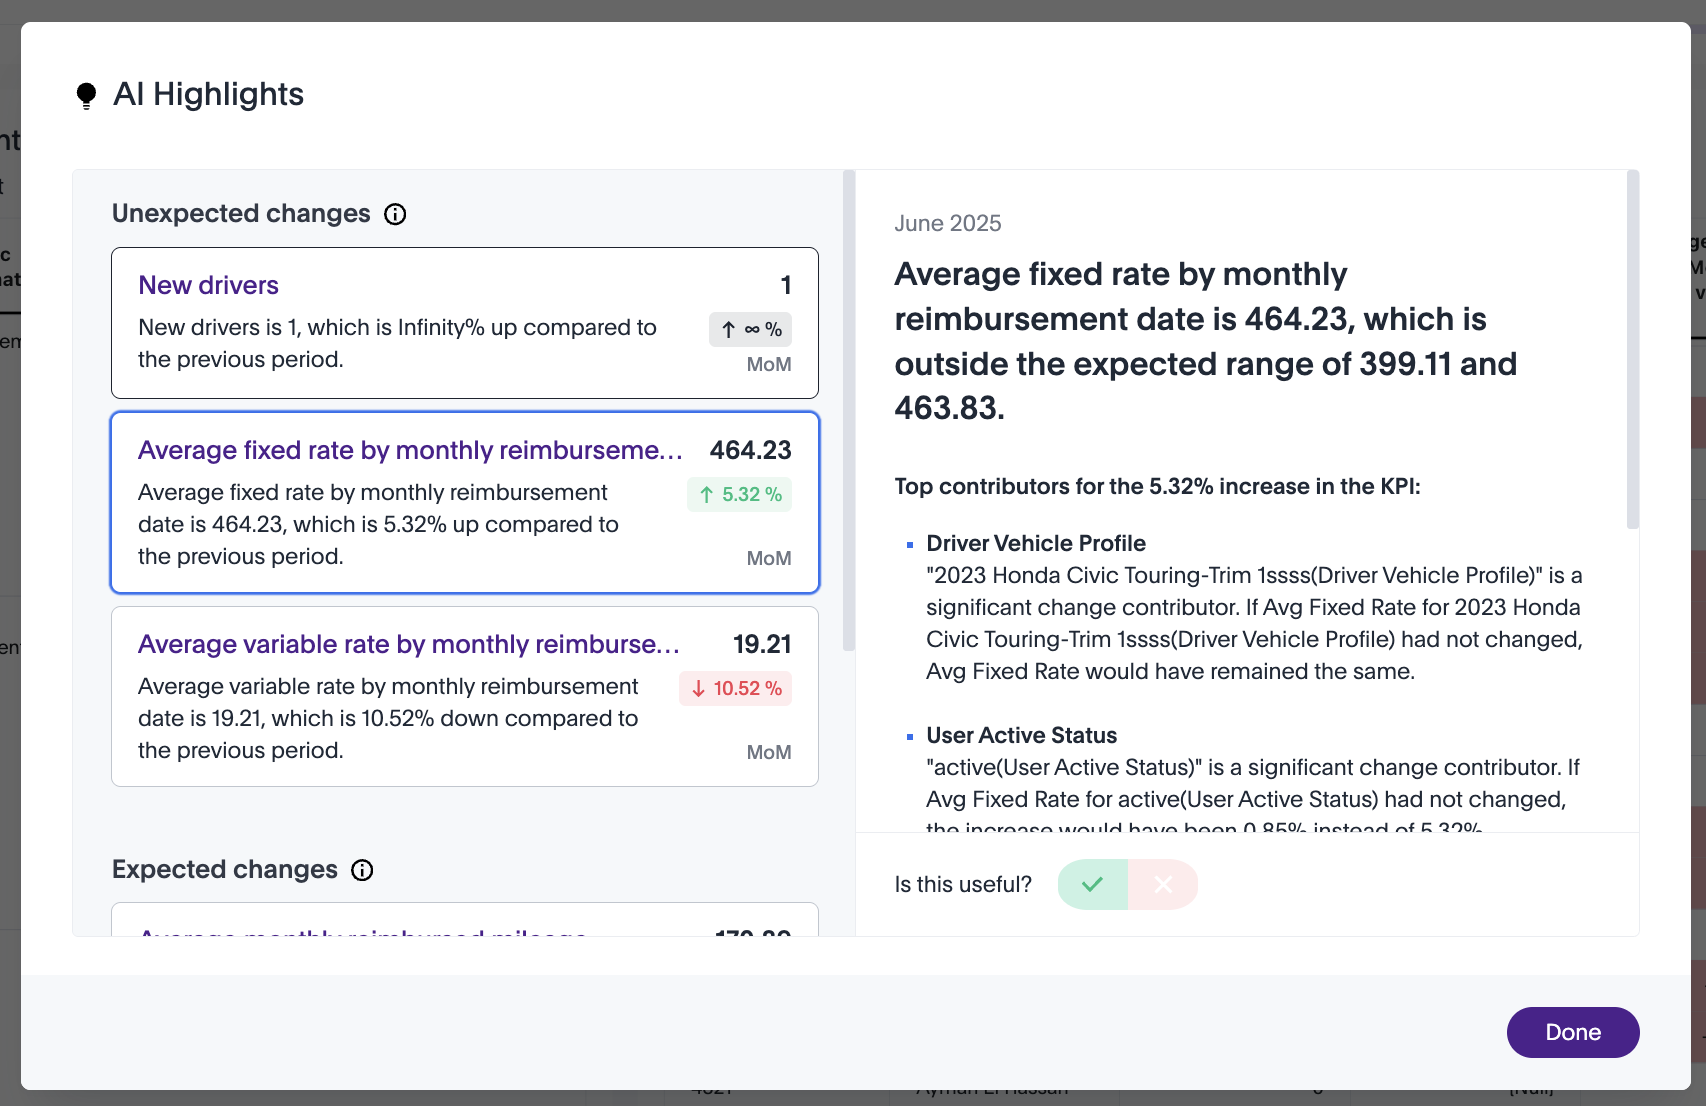
- Your highlights pop up in a summary window with 3 key sections:
Unexpected Changes
- Flagged when something deviates significantly from past behavior.
- Examples:
New driver added = Infinity% increase from 0
Average fixed rate increased 5.32%, now outside the expected range
- AI also explains why, using metadata:
A vehicle profile change (e.g., 2023 Honda Civic Touring) may be inflating fixed costs
Active driver status shifts might be influencing average reimbursements
Expected Changes
- Changes that occurred within predicted thresholds, meaning no surprise—but still good to know.
- Example:
Monthly reimbursed mileage increased 0.59%, normal range
Not Categorized
- Patterns that don’t fit known models but still show notable movement.
- Example:
Terminated drivers jumped from 0 to 2
A new province (PR) contributing to that trend
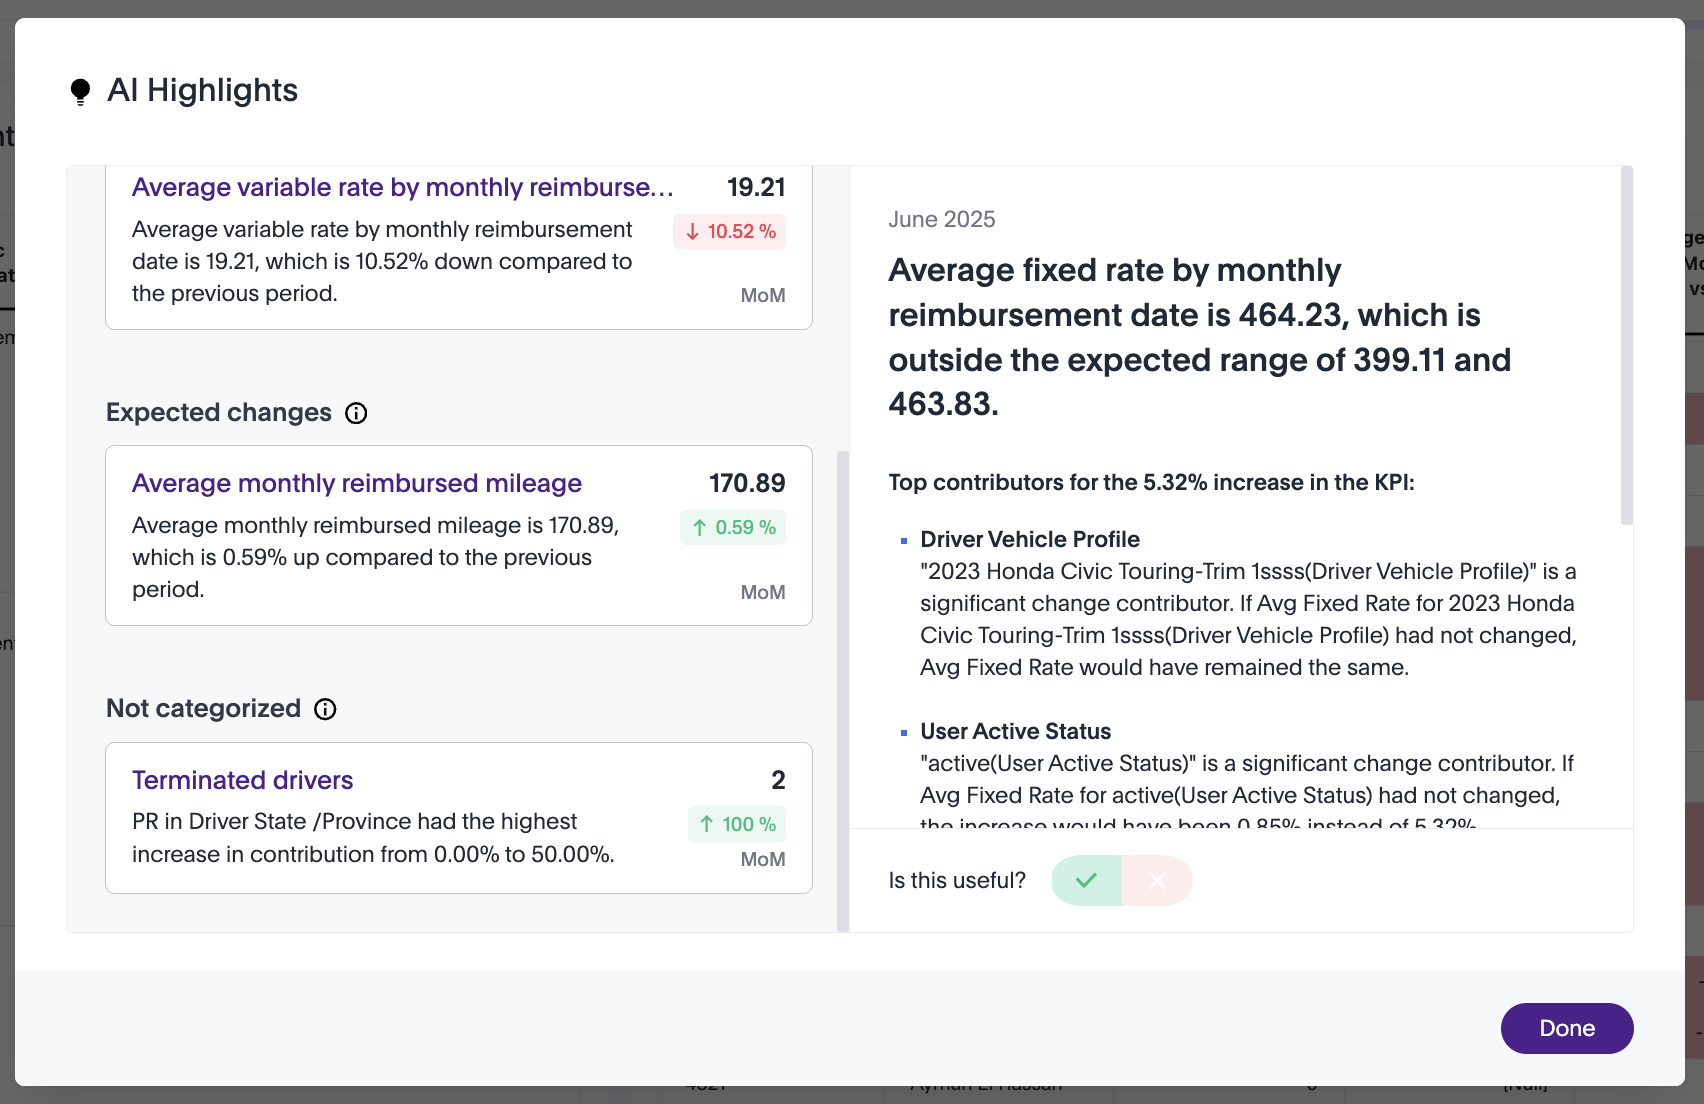
- We’re always improving AI Highlights, and your feedback helps! At the bottom of the summary, you’ll see:
Did this insight feel accurate and helpful?
✅ Click the green checkmark if it was helpful
❌ Click the red X if it wasn’t
Your response helps refine future AI output and ensures better insights going forward.

Why use AI Highlights?
- See the biggest changes in your data, instantly
- No manual analysis needed
- Root-cause explanation built in
- Catch operational risks or cost spikes early
- Understand trends across drivers, vehicles, statuses, and more